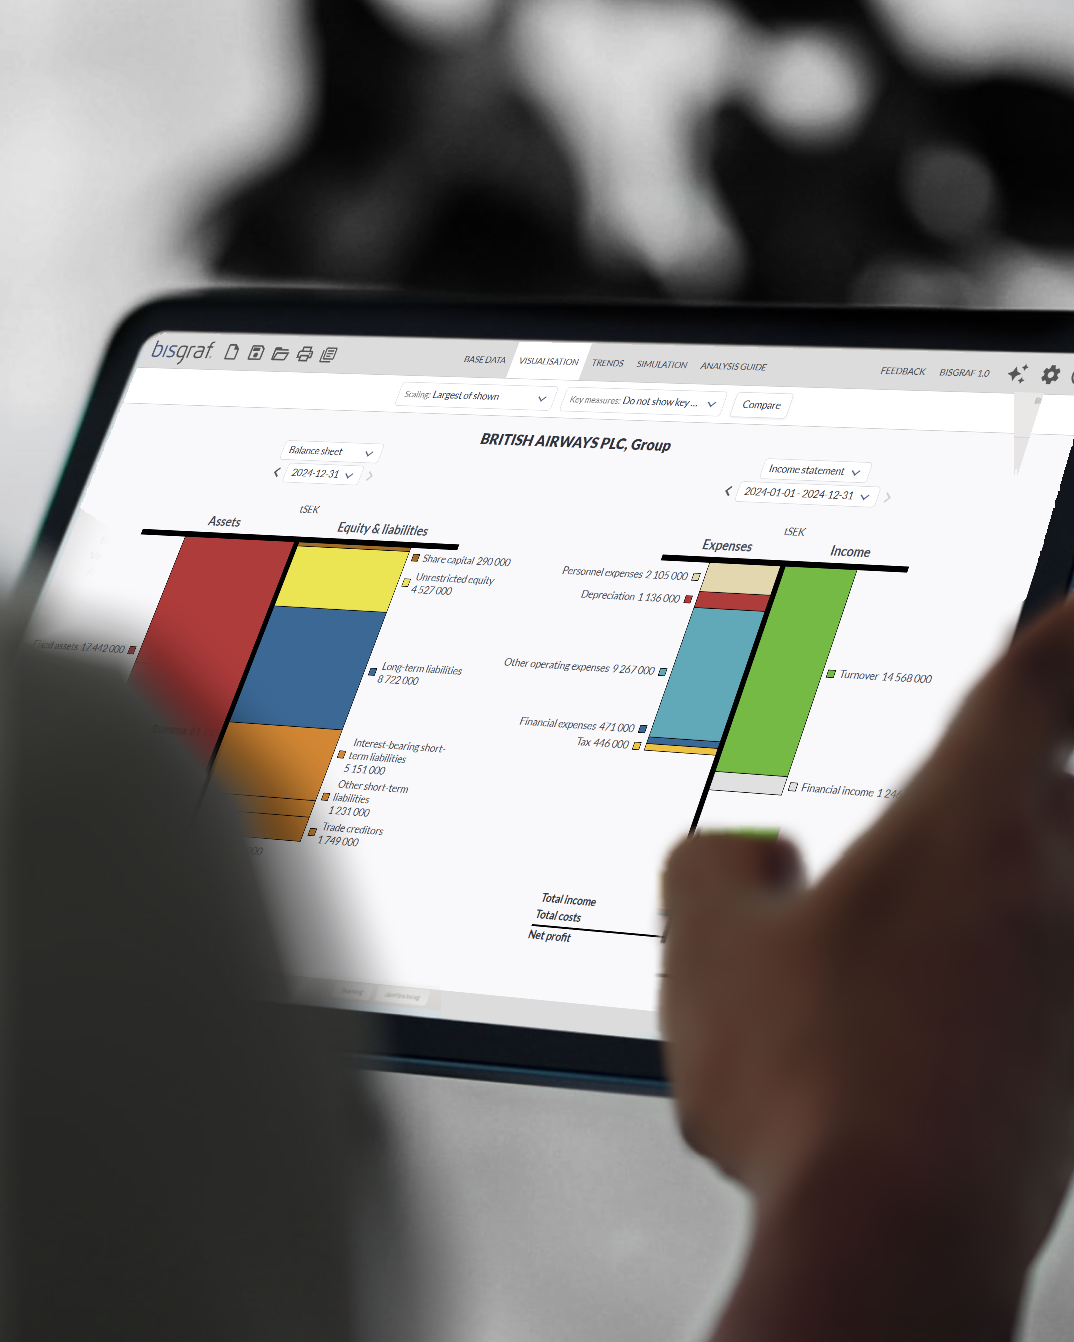
Bisgraf illustrates financial statements, allowing you to see the various components of a business operation, their outputs as well as how they have trended. With over 70 KPI’s just a click away, Bisgraf allows you the opportunity to search and see a business from the same perspective as an executive.


Many struggle with understanding and interpreting financial reports. Thus, there is a risk of missing out on the lessons of history, seeing future challenges and making wise business decisions.
Based on Bonanza's method The Visual Language of Finance, Bisgraf offers a tool that transforms difficult-to-interpret financial statements in tabular format into easy-to-understandvisualizations.
With Bisgraf, you have access to public accounts for over hundred thousand companies, which allows you to benchmark companies to quickly discover discover differences and opportunities.
Bisgraf is the shortcut to insights about a company's financial performance. Depending on why you want to look at a company, Bisgraf offers different insights. Take a few minutes to see how Bisgraf can benefit you.

Understand how future plans and events impact future cash flow. See and understand the financial value of a one day or one percent change.
Align with various trends to see financial results. See how performance has changed within various parts of an operation to better understand where challenges and opportunities are.

Quickly get a view of a company's financial health by analyzing the balance sheet, income statement and cash flow.
Bisgraf simplifies Cash and Profit analysis. Understanding where a business is currently is the first step towards building future strategies to drive desired outcomes.
You get access to all Bisgraf's features for five days and can then choose the license that suits you best.

Bisgraf offers many features to facilitate the analysis of the company's finances.
"Where do I start"? A common question we get asked by people who want to use financial statements to gather insights.
The power of Bisgraf's visuals is that they display various avenues to immediately engage with. Far spreadsheets with numbers and percentages alone, Bisgraf allows users to simply click a button to access over 70 KPI's visually, thus displaying not only the financial result, but also highlighting what parts of the operation are involved.
Bisgraf shows both the business and finance perspective of value.

No, all you need is a web browser (Google Chrome is recommended) with an internet connection.
Yes, no data is stored in the cloud.
Yes, a file is created and saved in the "Downloaded files" folder on your hard drive.
You need to open the file from within Bisgraf. Click on "Load file" and select the file from your file explorer.
In Bisgraf, there is a support feature where you can email your question, and we will contact you as soon as possible.
Yes, there are two options. You can use the "Print" button and select a printer. The other option is to copy the graphs and paste them into, for example, Word or PowerPoint.
Through a third-party solution by Bizzdo AB, you can link your accounting or import SIE files. This data will then become available in Bisgraf.
It is possible to create a new period and manually enter the values in the balance sheet and income statement.
Only limited liability companies have public annual accounts. If the company has another legal form, you will need to obtain the financial statements in another way, and then you can manually create a company in Bisgraf.
If you want to know more about how Bisgraf works and how you can best use the tool for your specific needs, please feel free to contact us.